Tuning Environment for i8051 Synthesizable Model
Note: Archictectural power tool and instruction set power tool require Synopsis Design Compiler.Link to Synthesizable 8051 Model
Introduction
One of the defining characteristics of embedded systems is that they run one application for their entire execution time. This characteristic creates a great potential for optimizations. For example, a general purpose processor might have a datapath consisting of a register file, ALU, and a shifter. For an instruction such as a move, this datapath is expensive in terms of power because it must pass through the ALU and shifter before being written back into the register file. If this move operation was very common to a particular application, an optimization could be made by modifying the register file to move data from one location to another.
The information on this page describes an environment that simplifies
the process of tuning a microprocessor. Three main tools are provided in
order to analyze the power consumption of an 8051 microprocessor. The first
of these tools is an architectural view which generates a hierarchical display
of power consumption throughout the components of the processor. The output
is formatted so that it is readable by xdu, a graphical program for
displaying tree structures. The second tool calculates the average power
per instruction for the entire instruction set (several jump instructions have
not yet been implemented in this tool). The third tool is an instruction set
simulator which outputs a program memory view that displays the instruction,
power, and frequency for every address. It also provides a data memory view
that calculates accesses for each location in ram.
Example
After running the initial version of the 8051, we obtained the following results:The table below shows a small sample of the output of the instruction set power tool. The actual output shows results for all instructions excluding several jumps which have not been implemented yet.
(Small sample of instruction set power, all values are in mW)
| ADDC_1 | 31.526465034965 |
| ADDC_2 | 38.1159 |
| ADDC_3 | 31.9229685314685 |
| ADDC_4 | 43.3595 |
| ADD_1 | 31.6965116550117 |
| ADD_2 | 33.2728333333333 |
| ADD_3 | 32.8297284382284 |
| ADD_4 | 41.2952333333333 |
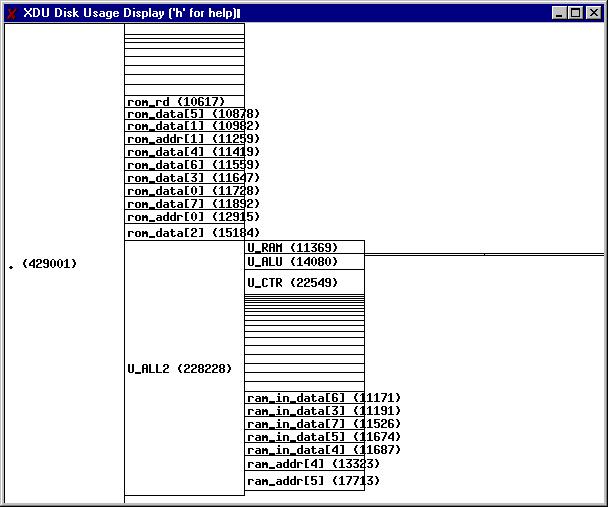
The image below shows the output from the architectural view tool. It can be seen that U_RAM, U_ALU, U_CTR, and the buses for RAM and ROM are the most expensive components. Xdu allows you to explore this hierarchy in much more detail than is shown in the image.
(Architectural view tool output displayed in xdu, values are in 1/1000mW)
The table below displays output from the program memory view that is provided by the instruction set simulation tool. For every location in program memory, it displays the address, instruction, frequency of execution, average power, and power * frequency. This view makes it easy to determine which area of the program is the bottleneck in terms of power consumption.
(Small sample of program memory view, power is in mW)
| Addr | Ins | Freq | Pwr | Pwr*Frq |
| 00727 | XCH_1 | 15901 | 4.78177 | 76034.9 |
| 00728 | XCH_1 | 15901 | 4.78177 | 76034.9 |
| 00729 | RRC | 15901 | 3.86277 | 61421.9 |
| 00730 | XCH_1 | 15901 | 4.78177 | 76034.9 |
| 00731 | INC_1 | 16474 | 3.90566 | 64341.9 |
| 00732 | JNZ | 16474 | 0 | 0 |
A small sample of ram accesses are shown below. It is obvious in this that the example most frequently locations are the accumulator and psw.
(Small sample of ram location frequencies)
| Addr | Freq | Type |
| 00000 | 32557 | RegBank0 |
| 00001 | 32334 | RegBank0 |
| 00002 | 27461 | RegBank0 |
| 00003 | 30042 | RegBank0 |
| 00004 | 101096 | RegBank0 |
| 00005 | 103961 | RegBank0 |
| 00006 | 94789 | RegBank0 |
| 00007 | 116525 | RegBank0 |
| 00336 | 939913 | PSW |
| 00352 | 1003559 | ACC |
| 00368 | 11015 | B |
Installation Instructions
(All files should be downloaded into the same directory)1) Download i8051pwranalysis.tgz.
2) Download Xdu for graphical tree representations.
3) Download install.scr.
4) Run install.scr.
5) The sample output is located in the following locations:
Architectural view => ph_results/*.xdu
Instruction set power => inspower.txt
Program memory view => iss_results/*.pmp
Data memory view => iss_results/*.ram
Execution Instructions
1) In order to run all tools and generate a report, run all.pl [version]. [Version] is used to print a version name on the generated report. All scripts are located in the i8051pwranalysis directory.2) The xdu executable is in the xdu directory. It can be used on all files in the i8051pwranalysis directory that have a .xdu file extension.
3) Individual tools and scripts are described in detail at this link.